The Economics of Crime: An Institutional and Macroeconomic Appraisal
Introduction:
The Satirical Premise and Bastiat's Fallacy
Economic analysis has occasionally engaged with the counterintuitive premise that criminal activity can serve as a form of macroeconomic stimulus. To explore this premise, economists and social theorists have historically employed satire and irony to critique the structural absurdities of national accounting systems. Jonathan Swift, in his 18th-century tract A Modest Proposal, and later satirists like John Kenneth Galbraith, used ironic economic arguments to expose how the mechanical pursuit of raw data can decouple from actual human welfare.
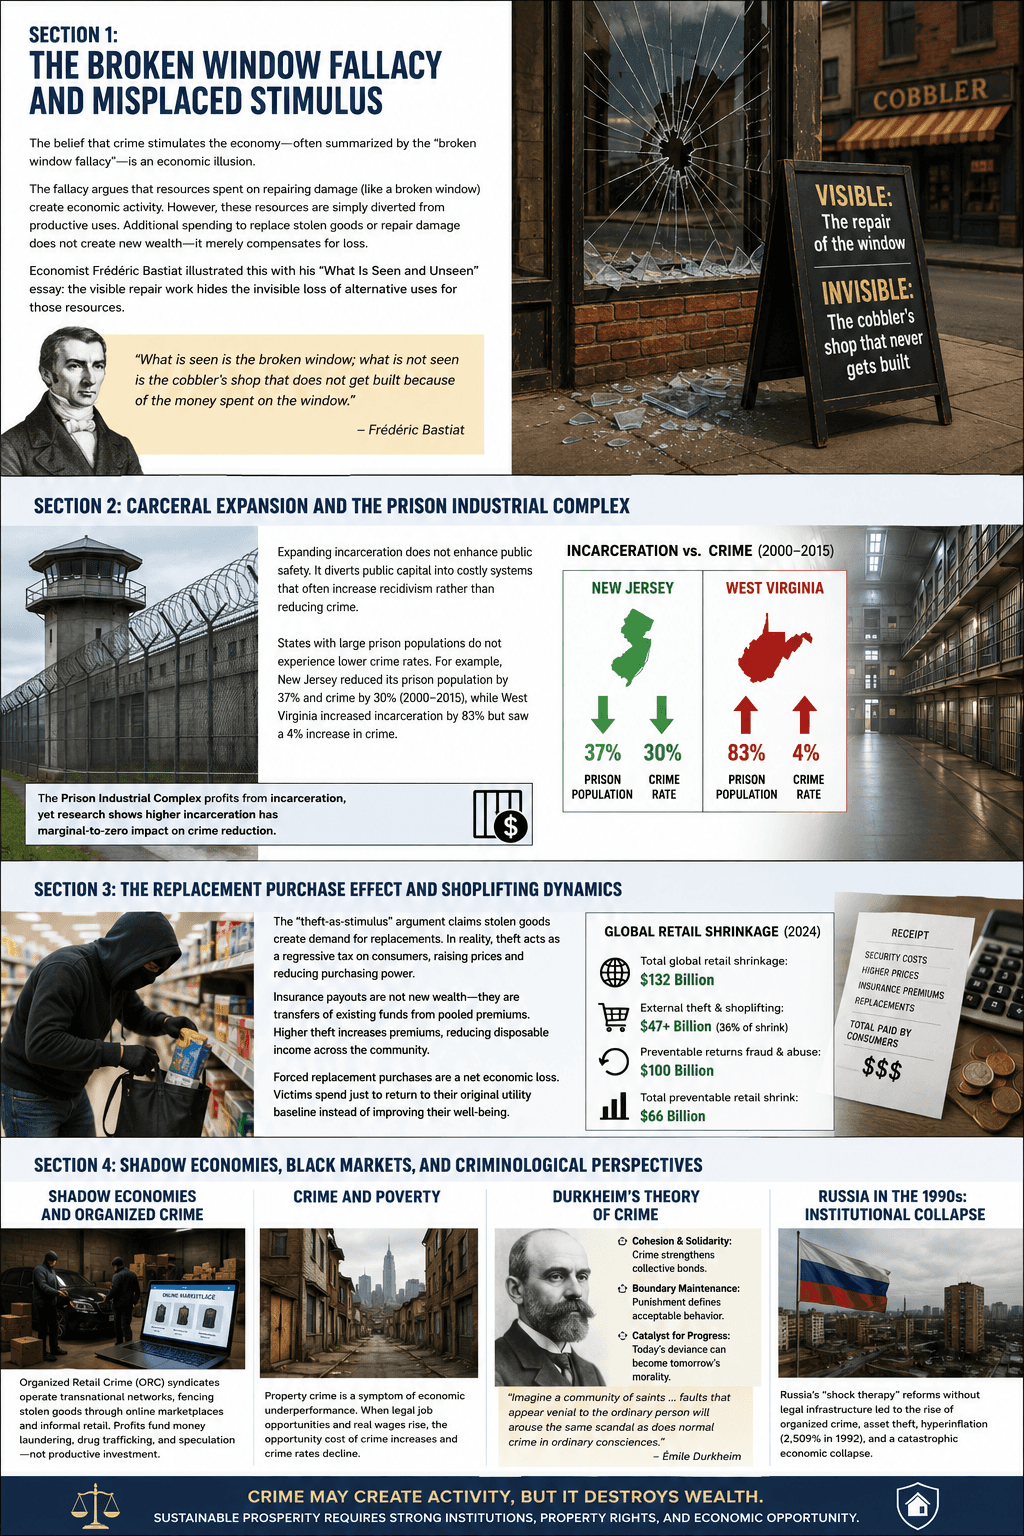
The intellectual foundation for deconstructing the “crime-as-stimulus” argument is Frédéric Bastiat’s seminal 1850 essay, That Which Is Seen and That Which Is Unseen. Bastiat exposed the core analytical error of treating destruction or forced transfer as a source of net wealth creation, a misconception popularized as the “Broken Window Fallacy.” In Bastiat’s parable, a shopkeeper's window is shattered by a vandal. The visible transaction—the shopkeeper paying a glazier to repair the glass—is heralded by local onlookers as an economic blessing because it generates employment and circulates currency.
What remains invisible in this localized transaction, however, is the opportunity cost: the capital spent to restore the window to its original state would have otherwise been deployed by the shopkeeper to acquire new utility-enhancing goods, such as a suit or a pair of shoes. The society as a whole is not wealthier by the value of a repaired window; rather, it has lost the value of the shoe or the suit that would have been created had the window not been broken. Society is ultimately poorer by the value of the destroyed asset.
This distinction marks the analytical boundary between wealth creation and wealth redistribution. Real wealth creation is a positive-sum process wherein resources are combined or transformed to yield higher aggregate utility, productive capacity, or welfare. Crime, by contrast, is a zero-sum or negative-sum redistribution enforced through coercion or stealth. Theft simply shifts ownership of existing assets without generating net value, while simultaneously destroying utility and consuming scarce resources in both the execution and prevention of the transfer.
Despite the mathematical certainty of Bastiat’s critique under normal economic conditions, macroeconomic paradigms—specifically early Keynesian theory—have contemplated conditions under which forced expenditures might act as a demand-side stimulus. During a deep recession or depression characterized by high unemployment and capital hoarding, an economy suffers from a structural shortfall in aggregate demand. If wealth is hoarded in unproductive, idle accounts, forced spending—even when triggered by property damage, theft, or natural disasters—can theoretically compel the circulation of otherwise dormant capital. Under these specific recessionary conditions, the opportunity cost of repairing a window or replacing a stolen item approaches zero because the hoarded capital would not have been spent on any other productive enterprise.
However, no mainstream modern economist argues that crime has a net positive effect on Gross Domestic Product (GDP). Under conditions of full resource employment, aggregate output is bound by productive capacity, and any resource diverted to mitigate crime or replace stolen goods represents a direct deadweight loss that reduces the long-term wealth of the nation.
To model the individual decision-making process underlying criminal behavior, Gary Becker (1968) established a rational-choice framework. Becker posited that an individual decides whether to engage in criminal activity by conducting a cost-benefit analysis, weighing the potential legal income against the expected utility of illegal gains, adjusted for the probability of apprehension and the severity of punishment.
In Becker’s framework:
p represents the probability of apprehension and conviction.
Y represents the monetary and psychic return from the criminal act.
F represents the monetary equivalent of the legal penalty.
Wlegal represents the legal wage rate.
This framework demonstrates that property crime is structurally linked to poverty and legal labor market performance. As legal employment opportunities expand and real wages rise, the opportunity cost of criminal behavior increases, structurally discouraging crime.
Section 1: Security Industry Economics and Defensive Expenditures
The global private security sector represents one of the largest and most rapidly growing industries in the world, functioning as a direct institutional response to property crime, burglary, and retail shrinkage. While this sector employs millions of workers, economists classify security spending as a “defensive expenditure” rather than a productive contribution to human welfare. Defensive expenditures are costs incurred to protect society from the negative externalities of its own development, social failures, or institutional collapse.
Standard national accounting systems, such as Gross Domestic Product (GDP), treat security spending as positive economic growth. GDP measures the aggregate market value of all final goods and services produced within a country, utilizing an input/output framework that treats every marketed delivery as a positive contribution to “final demand.” This creates a fundamental measurement paradox: an oil spill, a rise in burglary rates, or a natural disaster increases GDP because of the associated cleanup, legal, and security expenditures, even though these events clearly detract from overall societal well-being.
To address this limitation, the Genuine Progress Indicator (GPI) subtracts defensive expenditures—including spending on private security, surveillance, locks, and carceral services—from personal consumption figures. By separating welfare-enhancing production from welfare-defending expenditure, the GPI provides a more accurate metric of sustainable economic health.
Global Security Industry Statistics
Global Physical Security Industry
Market size: $405.0 billion in 2023, projected to reach $500.0 billion by 2026.
Geographic highlights include China at $14.8 billion (29%), North America at $13.6 billion (27%), and Europe at $9.5 billion (19%).
The industry employs more than 30 million people globally, including 8 million in services and 22.6 million end users.
Source references include ASIS International and SIA.
Global Physical Security Hardware and Systems
Market size: $120.83 billion in 2025, projected to reach $222.25 billion by 2034.
North America accounts for $54.83 billion in 2025, while Europe accounts for $17.62 billion.
Commercial and industrial sectors hold 67.24% of market share.
Source: Fortune Business Insights.
Global Security Services (Manned Guarding)
Market size: $101.3 billion in 2025, projected to reach $154.3 billion by 2035.
Growing at 4.3% CAGR.
The segment alone grew by $6.5 billion between 2025 and 2026.
Allied Universal holds approximately 26.1% market share, generating $20 billion in revenue and employing 800,000 workers.
Sources include Fact.MR, BLS, and AInvest.
Global Locks and Smart Locks Market
Market size: $38.8 billion in 2025, projected to reach $65.1 billion by 2035.
North America remains the largest market.
China controls 33.6% of the Asia-Pacific market share.
ASSA ABLOY holds more than 4% market share, while the top five companies collectively control 10%.
Source: Global Market Insights.
Global Ballistic Protection Market
Market size: $15.3 billion in 2024, projected to reach $26.0 billion by 2034.
Personal protection accounts for $7.3 billion.
Vehicle protection is the fastest-growing segment at 7% CAGR.
Growth is driven by rising defense budgets and law enforcement demand.
Source: GMInsights.
Global Smart Home Security Market
Projected to reach $39.0 billion by 2029.
An estimated 1.1 billion households are expected to adopt smart security systems by 2029.
Growth is driven by declining prices for smart locks and cameras.
Source: Statista.
Global Security Camera Market
Market size: $17.2 billion in 2025, projected to reach $24.2 billion by 2029.
Expected annual growth rate: 8.83%.
Approximately 578.5 million households are projected to own cameras by 2029.
Source: Statista.
This private security industry employs over 30 million people worldwide. In the United States, the security services sector is valued at $49.1 billion, with the guard and patrol services segment alone accounting for $36.6 billion—roughly three-quarters of the total industry revenue. This highlights that human personnel remain central to security operations despite the rapid advancement of electronic monitoring systems.
Major corporate actors, such as Spain-based Prosegur, have seen significant profitability. Prosegur Security recorded a turnover of €2.604 billion in 2025, representing a 4% year-over-year increase, while Prosegur Cash recorded €987 million in sales.
The allocation of human capital to security roles exposes a stark economic contrast between low-crime nations and high-crime nations. Countries characterized by high institutional trust and low crime rates, such as Japan and Iceland, do not suffer from structural unemployment due to their smaller security sectors. Instead, they exhibit superior economic efficiency: labor that would have been locked into defensive guarding or monitoring roles is freed to engage in directly productive industries, such as high-technology manufacturing, software development, and healthcare.
Conversely, high-crime nations suffer from a “security tax.” A substantial percentage of their labor force and capital is diverted to unproductive tasks—such as guarding retail storefronts, operating checkpoints, and maintaining physical barriers—which acts as a structural drag on long-term productivity and economic growth.
Section 2: Law Enforcement and the Justice System Economy
The public-sector infrastructure of crime control—comprising policing, judicial prosecution, and correction facilities—consumes a substantial portion of local, regional, and national government budgets. If property crime and violent crime were drastically reduced, these tax revenues could be dynamically reallocated toward productive public goods, such as education, public infrastructure, and basic scientific research, which generate compounding returns on investment.
International Prison Cost Comparisons
Russian Federation
Annual cost per prisoner ranges from €960 to €2,390.
Equivalent to approximately $1,050 to $2,600.
Average daily cost ranges from €2.50 to €2.63.
Costs are partially offset by forced labor.
Source: Council of Europe penal statistics.
United States (Arkansas)
Annual cost per prisoner: $23,000.
Average daily cost: approximately €57.
Represents the lowest spending state based on 2025–2026 data.
United States National Average
Annual cost per prisoner: $33,274.
Average daily cost: approximately €82.
Based on 2015 state prison baseline data.
United Kingdom (England and Wales)
Annual cost per prisoner increased from £53,801 in 2023–2024 to £56,618 in 2024–2025.
Equivalent to approximately $68,500–$72,000.
Average daily cost ranges from €147 to €155.
Average cost per prison place is £59,026.
Source: Ministry of Justice.
United States (California)
Annual cost per prisoner: $128,000.
Average daily cost: approximately €315.
Driven by highly unionized staffing and complex medical care.
United States (Massachusetts)
Annual cost per prisoner: $307,468.
Average daily cost: approximately €760.
Costs are driven by high operational overhead and low inmate-to-staff ratios.
Bulgaria
Average daily cost: €6.50.
Lowest daily prison cost in the European Union.
Norway
Average daily cost: €330.60.
High investment in rehabilitation and restorative programs.
In the United Kingdom, the capital expenditure required to maintain and expand the prison estate is exceptionally high. The initial prison expansion programme, announced at £5.2 billion in 2021, has escalated to an estimated £9.4–£10.1 billion by its projected completion in 2031.
Additionally, the Ministry of Justice’s prison estate conditions survey revealed that bringing the existing estate to a “fair” condition requires £1.4 billion, with another £1.4 billion needed to ensure fire safety compliance. Once completed, this expansion is expected to increase annual operational running costs by approximately £670 million.
This contrasts sharply with the £1.5 billion net resource expenditure allocated to the entire probation service, which supervises 239,015 individuals in the community at a fraction of the incarceration cost. The social and economic costs of reoffending in the UK are estimated at £18.1 billion annually.
In the United States, the expansion of the Prison-Industrial Complex (PIC) has institutionalized powerful financial incentives to maintain or increase incarceration rates. Private prison corporations, such as CoreCivic and the GEO Group, manage more than half of all private prison contracts in the United States, earning combined annual revenues exceeding $4 billion.
These firms frequently integrate “bed guarantees” or minimum occupancy clauses into contracts with state and federal governments. These clauses require governments to maintain occupancy levels often between 80% and 100%, or pay penalties for unused beds. As a result, governments can be financially punished for successfully reducing crime.
These corporations also engage heavily in political lobbying. CoreCivic spent $10.6 million on immigration-related lobbying between 2008 and 2014, including $9.76 million directed toward the House Appropriations Homeland Security Subcommittee.
The expansion of the carceral footprint is evident in corporate profitability. CoreCivic reported $538.2 million in revenue during the second quarter of 2025, a 10% increase over 2024. The company reopened major facilities, including the 2,400-bed South Texas Family Residential Center in Dilley, Texas, and the 1,000-bed Delaney Hall facility in Newark, New Jersey.
However, these operations have faced significant legal challenges. A lawsuit in Washington State forced the GEO Group to pay $23 million to immigrant detainees who had been compensated only $1 per day for labor performed under the company’s Voluntary Work Program.
Empirical evaluations by the Vera Institute of Justice and the National Research Council demonstrate that the return on investment (ROI) of mass incarceration is extremely low, with diminishing marginal returns. Since 2000, increased incarceration has had a near-zero effect on reducing overall crime.
Research indicates that between 75% and 100% of the historic crime decline since the 1990s is explained by macroeconomic and demographic factors such as:
Aging populations.
Rising graduation rates.
Real wage growth.
Consumer confidence.
These reductions are not primarily attributable to expanded incarceration.
Any modest deterrent effects associated with incarceration apply mainly to nonviolent property crimes. Higher incarceration rates show no statistically significant association with reduced violent crime.
For example:
New Jersey reduced its prison population by 37% and its crime rate by 30% between 2000 and 2015.
West Virginia increased incarceration rates by 83% during the same period, yet experienced a 4% increase in crime.
Section 3: The Replacement Purchase Effect and Shoplifting Dynamics
Proponents of the “theft-as-stimulus” argument rely heavily on the replacement purchase effect: the notion that when goods are stolen, victims must purchase replacements, thereby injecting new demand into the retail economy. However, rigorous empirical analysis of global retail shrinkage, shoplifting, and insurance mechanics reveals this argument to be a macroeconomic illusion.
In 2024, global retail shrinkage reached a projected $132 billion, up from $112 billion in 2022. External theft and shoplifting accounted for approximately 36% of annual shrinkage, representing more than $47 billion in direct global property losses. Preventable returns fraud and abuse contributed another $100 billion in losses.
Retail Shrinkage and Loss Categories
Preventable Returns Fraud and Abuse
Annual financial value: $100 billion.
Includes receipt fabrication, returning stolen merchandise, and “wardrobing.”
Source: Appriss Retail.
Preventable Retail Shrink
Annual financial value: $66 billion.
Represents 73% of total shrink.
Includes employee theft, operational errors, and organized retail crime.
Source: Appriss Retail.
Employee/Internal Theft
Annual financial value: $26 billion.
Represents 29% of total shrink.
Includes theft of cash and high-value inventory.
Source: Appriss Retail.
Inventory and Tracking Errors
Annual financial value: $19 billion.
Represents 21% of total shrink.
Includes clerical discrepancies and scanning system errors.
Source: Appriss Retail.
Operational Inefficiencies
Annual financial value: $12 billion.
Represents 13% of total shrink.
Includes process failures, supplier friction, and product damage.
Source: Appriss Retail.
Organized Retail Crime (ORC)
Annual financial value: $9 billion.
Represents 10% of total shrink.
Includes professional coordinated theft operations for black-market resale.
Source: Appriss Retail.
The financial impact of this theft is not absorbed entirely by retail corporate profits. Instead, it functions as a regressive tax on consumers. When department stores experience high theft rates, they incur major security costs and must either raise prices or close unprofitable locations.
This contributes to the creation of “food deserts” and reduces employment opportunities within affected communities.
The insurance industry also does not generate net economic stimulus during loss events. Insurance payouts represent horizontal transfers of existing capital rather than the creation of new wealth. The funds used for payouts originate from pooled premiums paid by policyholders.
As theft rates increase:
Insurance premiums rise for the entire community.
Disposable income declines.
Consumer spending in other sectors decreases.
Insurance companies increasingly require security upgrades.
These security requirements redirect additional private capital into defensive technologies instead of productive investment.
Forced replacement purchases therefore represent a net economic loss. Victims are compelled to spend money merely to restore their original utility baseline rather than improve their quality of life.
Section 4: Shadow Economies, Black Markets, and Criminological Perspectives
Property crime and theft do not occur in isolation. They are deeply integrated with informal sectors and organized criminal syndicates. In developing nations, extensive black markets and informal economies often emerge from institutional failures. Property crime feeds these informal systems by enabling the distribution of stolen merchandise at deeply discounted prices.
Organized Retail Crime (ORC) syndicates operate as sophisticated transnational enterprises, accounting for roughly 10% of all retail shrinkage. These groups utilize advance
d fencing networks, laundering stolen goods through legitimate online marketplaces and informal retail fronts.
Profits generated through these activities are rarely reinvested into productive sectors. Instead, funds are frequently channeled into:
Money laundering.
Drug trafficking.
High-yield real estate speculation.
Comments
More Blogs
Explore more articles that you may find interesting.
